Pascal RIPPLINGER, Grenoble, 2013
GIS in the development context – Participatory GIS
GIS is used in developing countries. Because of some difficulties in the use of GIS on a macro level, there is an alternative method, participatory GIS.
Keywords: New technologies for peace
The use of GIS in developing countries
In the beginning, GIS was mostly used in the military but since the prices of hardware have declined the software became available for the public and private sector. GIS technologies are applied to urban planning, for location studies, infrastructure planning and many other spatial related issues. At first, GIS applications were mainly available in Western countries. A reason is that, for GIS, a considerable database is necessary which is absent on most developing countries. Multilateral donor organizations have stimulated GIS use in the development projects they finance. Its potential applications are resource inventory and monitoring through land use planning, evaluation of used land, health studies, biological control, irrigation and drainage, social and economic planning, and disaster avoidance, management of conservation areas and parks as well as tourism planning (BURROUGH 1992).
One of the limits of GIS in the beginning was that it was mostly used at the national level as a top-down planning instrument. These macro-level maps were often not useful at the level of communities because they are not detailed enough as a result of lack of data. Small villages would only be mapped as points for example. Information about boundaries, houses, and streets as well as social information is lacking. Moreover without a database, it is not possible to make spatial analysis. As a reaction, the organizations started to support the application of GIS at regional and local levels a few years later. (CHRISTIANSEN 1998, p. 45).
A remaining obstacle is that decision makers, those in charge of development, and citizens in rural and urban areas often can’t identify with projects based on top-down approaches. Moreover, local governments often do not see the sense of GIS use. Furthermore, local users are often dependent on the know-how of external consultants so that the duration of GIS-use is often only possible as long as the financial support is available. Another problem is that the data exchange and the cooperation between different projects often don’t work.
GIS software is relatively expensive so that it is often not possible to buy the software and the datasets for community institutions in developing countries. Accordingly, open-source GIS-software is an alternative solution. Moreover UN-Habitat started the 1000-cities program in cooperation with ESRI to distribute free ArcGIS software in 1000 cities in developing countries on different levels. (UN HABITAT 2003)
In spite of the critical aspects, there is no alterative of the use of GIS for spatial and social planning issues. The question therefore is how to make GIS more participatory.
Participatory GIS (PGIS)
An alternative to a top-down approach to GIS, is a focus on the inclusion of the local population in the process. Many people have never seen a map of their home town before, but they have important local and spatial knowledge about their area, which is important for the implementation of development projects. Participatory GIS was therefore means a move in the direction of a bottom-up approach, through for example combining GIS with Participatory Rural Appraisal(PRA). PRA is a method to collect data with the support of the local population to include them into management and planning processes. The aim is the empowerment of the local population. But in the earlier use of PRA spatial data was not collected. So the approach of Participatory GIS combines spatial information with local knowledge from which the locals and the planning institution will benefit. This has the potential to reduce conflicts (See the following File: PGIS as a conflict transformation tool.).
In developing countries, PGIS is primarily used in rural areas to improve the management of natural resources. An example from South Africa in ABBOT ET AL (1998) shows how mental maps made by white and black farmers concerning soil quality and access to land were combined with official land survey maps. So it was possible to observe contradictory points of view and according to those implement a democratic land use planning, preventing conflict between white and black farmers over land-use.
In cities of developing countries, PGIS is used in the management of informal settlements and slum upgrading programs (CHRISTIANSEN 2007, p. 19). For example is it possible to localize problems in the area which are mentioned by the local population. So it is for instance possible to find damaged water pipes or water taps which play a role in water-supply improving programs. With maps it could be localized where the problems are and where an improvement makes sense.
Methods
PGIS includes several methods to include the local population in the mapping process, and “integrates several tools and methods, whilst often relying on the combination of expert skills with socially differentiated local knowledge” (RAMBALDI ET AL. 2005, p.2). That means that the tool is adapted to the local circumstances and technical possibilities. The aim of each method is to map or to show local conditions in 3-D-models. Moreover, the PGIS process generates “a great sense of confidence and pride which prepares the people to deal with outsiders. The process fuels self-esteem and raises awareness about pressing issues in the community“ (RAMBALDI ET AL. 2005, p. 3). Before the mapping begins, the kind of data that will be collected is fixed by the different participants. Then, the data will be collected together with the participants with GPS machines and other mobile hardware, like tablet PCs, before it will be added to GIS software or to paper maps/orthophotos. If the hardware is not available the non-technical alternatives such as sketch-maps could be used. Afterwards the maps will be geo-referenced and digitalized. Geo-referenced means to define the existence of information in the physical space.
The following list from CORBETT ET AL (2005) presents methods from very basic to high technical utilization.
Ephemeral mapping: this most basic method involves drawing maps on the ground. Participants use raw materials like soil, pebbles, sticks and leaves to represent the physical and cultural landscape.

Sketch mapping is a slightly more elaborate method. A map is drawn from observation or memory. It does not rely on exact measurements, such as having a consistent scale, or geo-referencing. It usually involves drawing symbols on large pieces of paper to represent features in the landscape.
Scale mapping is a more sophisticated map-making method aimed at generating geo-referenced data. This allows community members to develop relatively accurate scaled and geo-referenced maps, which can be directly compared with other maps.
3D modeling integrates spatial knowledge with elevation data in order to produce three-dimensional stand-alone, scaled and geo-referenced relief models. Geographic features relating to land use and cover are depicted on the model by the use of pushpins (points), yarns (lines) and paints (polygons). When the model is finished, a scaled and geo-referenced grid is applied to facilitate data extraction or importation. Data depicted on the model can be extracted, digitized and plotted.

Photomaps are printouts of geometrically corrected and geo-referenced aerial photographs (orthophotographs). Orthophoto-maps are a source of accurate, remotely sensed data that may be used for large-scale community mapping projects. Community members can delineate land use and other significant features on transparencies that have been overlaid on the photomap. Information on the transparencies can be scanned or digitized and geo-referenced later. Remote sensing images at a suitable scale are an increasingly appropriate alternative, when they can be easily and freely (or very cheaply) downloaded from the Web.

Global Positioning Systems (GPS) have become more affordable, and their use has spread rapidly among NGOs and community organizations. GPS is a satellite-based positioning system that can tell you your exact location on the earth using a known co-ordinate system such as latitude and longitude. The technology is often used for the demarcation of areas of land where access to and control over natural resources are in dispute. Data recorded are frequently used to add accuracy to information depicted on sketch maps, scale maps, 3D models and other less technology-rich community mapping methods.
Map-linked multimedia information systems are similar to GIS technologies but simpler to understand and manage. Local knowledge is documented by community members using digital video, digital photos and written text, stored on computers and managed and communicated through the interface of an interactive, digital map. By clicking on features of the interactive map the other multimedia information can be accessed.
GIS is a computer-based system designed to collect, store, manage and analyze spatially referenced information and associated attribute data. GIS technology is increasingly being used to explore community-driven questions. In the process, local spatially referenced, as well as non-spatial, data are integrated and analyzed to support discussion and decision-making processes. ‘Mobile GIS’ has become much better adapted to participatory and local community use since the development of GIS software designed to work with hand-held computers or laptop computers in the field.
From this technical point of view the following example should be clarify how the local population could be involved:
A Government planned to advance development projects all over the country, including mining, hydroelectric dams and roads. But land used by indigenous population was also affected by these plans. So it was decided to implement them in the planning process. Therefore local knowledge should be implemented in maps. To produce the maps different land uses were drawn in a geo-referenced map with different color-markers. Every color had another meaning: Agriculture (blue), income-generation-related services (yellow), culture (pink), and life-sustaining services (red). In the same time boundaries should be were tracked together with the elders with GPS machines. With the including of local knowledge it is maybe easier to implement projects and it reduces potential conflicts because their opinion plays a role in the development.
In the most cases the aim is to make the data accessible for everyone on the internet. (CHRISTIANSEN 2007)
SWOT-Analysis of PGIS
In the following the SWOT-Analyze after STEINMANN AND KERK (2005) will show and overview of the method of PGIS.
| Strengths | Weaknesses |
| • GIS is the best method for analyzing spatial data • Implementation of local knowledge in the decision making process: If the local population is included in the mapping process, which is used for planning decisions, they are involved in the process. • Maps are the best possibility to display spatial data: For what you can see on a map you need many words to describe in a text. • Higher access to the data by the local population: In case the data is published, what it should be, they have access to it through the internet or paper maps. • Possibility to participate in decision making processes. - Preservation of personal spatial information: local spatial knowledge can be conserved if it is saved in maps and used by later generations. • Statements of the participants are less influenced by other people. • Virtual environment: visualization with 3-D-modells or digital maps for instance. | • No internet access for the whole population: If the community no internet access they have no access to the data on which they were working on. • Marginalization of some parts of the population: Older people which are not able to use modern technologies could be excluded if the process is based on modern technologies. • Lagging of problem solving competence and often simplification of problems by the population: It could be possible that the population is not doesn’t take the mapping. seriously. • Lagging acceptance of new technologies: It might be possible that some people are not willing to work with digital media. • Falsification of the results through multiple system enters: if the data is often used and adapted it could be lead to falsifications. • Existing exception to digital offers by the population. |
| Opportunities | Threats |
| • Addendum to traditional methods: PGIS in an alternative to top-down methods so that the local population gets a voice in the planning process. • Higher participation: if the population recognized the importance of the mapping process and planning they are maybe more interested in participation. • Integration of a broader part of the population in spatial planning and conflict transformation. • Higher transparency: the population is integrated in the planning process before decisions were taken. So the planning process is more transparent. • Finding solutions in conflicts. | • Abuse of the populations trust : if the data is not used to improve the circumstances in the community but exclusive for the interests of the government. • Problems to differentiate serious and non-serious information: sometimes personal interests are playing a role, for instance in land-use issues. • Low willing of participation by the population: Maybe if they are not interest or if the use is not clear. • Divergence between technical and social development. |
Example for Data Collection with PGIS – MapKibera
Kibera is now considered one of the best-researched slums in the world. Nevertheless, there were no useful maps of the area until 2009, so it was marked on official maps of the government as ‘forest’ (JAKOB 2011). The lack of a reliable cartographic basis constrained development of the area. The aim of the initiatives started in October 2009 was to map whole of Kibera. They are available for everyone on the internet (mapkibera.org/).
In a few months, young residents of the area created a map of the slum and listed the water supply, hospitals, schools and social institutions. Therefore, 13 young people from each village in Kibera were trained in the use of technical equipment such as computers, WordPress (1) OSM (2) and GPS (HAGEN 2010). For the digital map of Kibera, which is also distributed in printed form, they use the platform Open Street Map. The main donor is JumpStart International, an NGO from the U.S. that works closely with Kenyan NGOs such as SODNET (Social Development Network), KCODA (Kibera Community Development Agenda) and CFRP (Carolina for Kibera). Due to the increasing awareness of the project, and the active promotion of the Project managers Erica Hagen and Mikel Maron, the number of ideal partners and supporters increases significantly (JAKOB 2011). Today, even the United Nations Children’s Fund (UNICEF) is one of the official project partners (see mapkibera.org/).
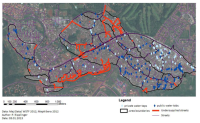
The data quality is evaluated as good because it is collected by the local population with local knowledge. Before the initiative, there was cynicism in the local population because many NGOs did research in Kibera before, but without making their work accessible for the local community. Because of the accessibility of the data, it is also easier for donors to locate the problems and shortcomings. If the government wants to implement a water kiosk in the area, some criteria must be considered. So according to already-existing safe water sources and a maximum walking distance to water tap areas, an undersupply can be located. Figure below shows an example of undersupplied main streets in Kibera for the whole slum.
Nevertheless, the most areas are undersupplied with good quality water, but as government you should start there where it is the worst. Moreover, violent places are located in the MapKibera project together with the locals. So it is not meaningful to implement a water kiosk there when women are in danger or to feel uncomfortable to go there.

Fiches associées :
Fiche de notion : Geographic Information System
Fiche d’expérience : Participatory GIS as a conflict transformation tool
Notes
(1) : Word Press is free software to create and manage websites.
(2) : Open Street Map = OSM: Is a collaborative project to create a map of the world which is free editable. The geo-data could be used for free in online maps or navigation systems. www.openstreetmap.org
Related articles
Experience file: Participatory GIS as a conflict transformation tool
The use of Participatory GIS (PGIS) as a tool for conflict transformation in order to reduce the potential for the outbreak of conflicts.
Pascal RIPPLINGER, Grenoble, 2013
Concept file: Geographic Information System
Pascal RIPPLINGER, Grenoble, 2013